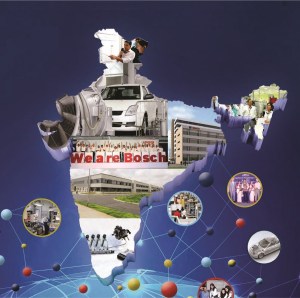
Combining innovation and focus on core business, Bosch India has been able to maintain its leadership despite many macro and micro headwinds.
Bosch Group is a leading global supplier of technology and services. It comprises of Robert Bosch GmbH and its roughly 440 subsidiaries and regional companies in 60 countries.
The company’s non-automotive business (Others) comprises of Industrial Technology, Consumer Goods and Energy and Building technology. Over the last five years, non-automotive segment’s contribution in total revenue increased marginally from 10% in 2011 to 13% in 2016.
Table 1: Revenue Contribution (All Figures in INR Million)
| Particulars | Automotive | Others |
| Revenue | 92,841 | 13,481 |
| EBIT | 15,716 | 805 |
| Capital Employed | 13,289 | 2,304 |
| RoCE | 118% | 35% |
Restructuring during last 5 years
2012
After an agreement between Robert Bosch GmbH and SPX Corporation, USA in January 2012, the company had acquired Indian unit of ‘Service Solutions’ business from SPX India Private Limited in December, 2012 on a going concern basis for an aggregate consideration of Rs 9.9 crore.
2016: Sale of Starter Motors and Generators business in India
In a move to realign its global Starter Motors and Generators division (SG), all the assets and liabilities pertaining to Starter Motors and Generators, transferred as a going concern on a slump sale basis for Rs 486 crore to a 100% subsidiary of Robert Bosch Starter Motor Generators Holding GmbH.
This division was started in 1989 and it broke even in 2013. Despite contributing 10% to the top line, EBIT contribution of the division was only 1% to the Bosch Limited’s total EBIT.
Wealth Creation for shareholders
Capital Appreciation
Last five years were exceptionally good for shareholders. Bosch Limited’s share price soared 200% as against the 30-share S&P BSE Sensex, which registered double-digit growth rate.
Dividend
Table 2: Dividend Pay-out Over the Years
| Year | Dividend per share |
| 2012 | 50 |
| 2013 | 60 |
| 2014 | 55 |
| 2015 | 85 |
| 2016 | 85 |
| Total | 335 |
In 2015, the promoter, Robert Bosch GmbH received Rs 190 crore in the form of the dividend. In 2016, Bosch maintained the same dividend.
Buyback
Financials
Please note that 2014-2015 represents 15 months’ period starting from January 2014 to March 2015.
Table 3: Capital Expenditure & Free Cash Flows (All Figures in INR Million)
| Particulars | 2016 | 2015 | 2013 | 2012 |
| Fixed Assets | 12,869 | 12,435 | 13,777 | 12,716 |
| Depreciation | 3,950 | 5,484 | 3,842 | 3,670 |
| Operating Cash Flow | 13,259 | 13,942 | 10,570 | 9,591 |
| Capital Expenditure | 4,384 | 4,142 | 4,903 | 7,262 |
| Free Cash Flow | 8,875 | 9,800 | 5,667 | 2,329 |
Table 4: Other Financials Year-Wise (All Figures in INR Million)
| Particulars | 2016 | 2015 | 2013 | 2012 |
| EBIT % | 16.95% | 15.84% | 13.80% | 14.97% |
| Borrowings | 191 | 555 | 1,316 | 1,850 |
| Net Worth | 82,807 | 73,470 | 62,943 | 55,733 |
| RoE | 15.05% | 18.21% | 14.06% | 17.19% |
| Capital Employed | 82,998 | 74,025 | 64,259 | 57,583 |
| RoCE | 22.45% | 27.07% | 19.56% | 23.47% |
| Total Assets | 1,14,956 | 1,04,308 | 88,910 | 79,039 |
| Fixed Assets Turnover Ratio | 0.96 | 1.21 | 1.02 | 1.14 |
| EPS | 397 | 426 | 282 | 305 |
Conclusion
Over the years, Bosch India’s focus and investment in technology paved the way for it to maintain its position. However, it generates free cash flow almost equal to PAT (as capital expenditure and depreciation in last three years are equal) which it does not need for expansion. If the company has no acquisition opportunity or plans, then the only option available is to go for frequent buyback as permitted under the law to compensate its shareholders. Bosch group has eight other group companies in India. It may also consolidate one or more of them if any of them need cash for expansion and in the process payout to holding company or increase its stake in the listed entity.
